timeline: 10 weeks
role: web developer, reporter
class: Visual Storytelling for the Web (Bay Area Immersion Program)
skills: web development, web design, HTML/CSS/JS, GSAP, photography, reporting, editing
the project
As part of Northwestern’s media-and-tech-focused Bay Area Immersion Program, my cohort took a class called Visual Storytelling for the Web. In it, we were encouraged to push past the often static presentation of journalism on digital platforms and learned the tools to make our own stories interactive.
My group's goal: to write a longform, interactive feature on the rise in popularity of film photography despite the increasing cost of materials.
the process
First, we researched recent film price trends.
One of the members of our group was an avid photographer and had already heard about the price hikes, but we needed to find data to legitimize our angle. And we found it – the prices of film equipment have steadily increased since 2007.
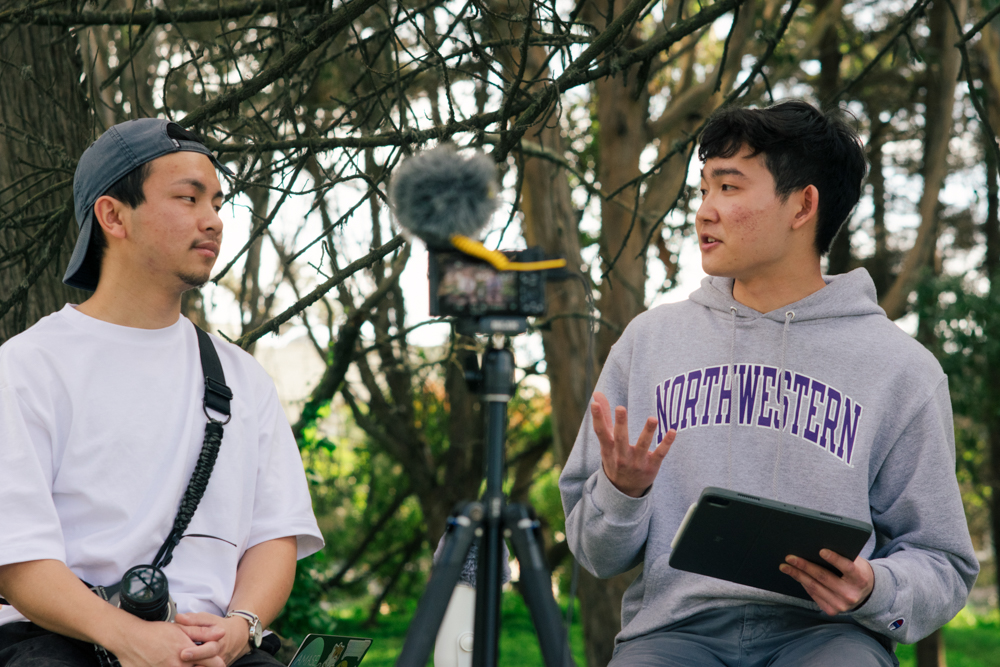
Josh, one of our group members, interviewed Bay Area photographer Chris Chu on camera as the rest of us controlled the interview audio and video.
Next, we talked to people.
- a Bay Area film photographer about how rising prices have changed the way he does his job
- the owner of a San Francisco film photography shop, who had recently been consistently selling out of film
- a student just starting out in photography by taking a class
We interviewed the people who are experiencing both the increase in film popularity and the increase in prices, including:
We then put it all together in an interactive, visual format that made understanding the material easy.
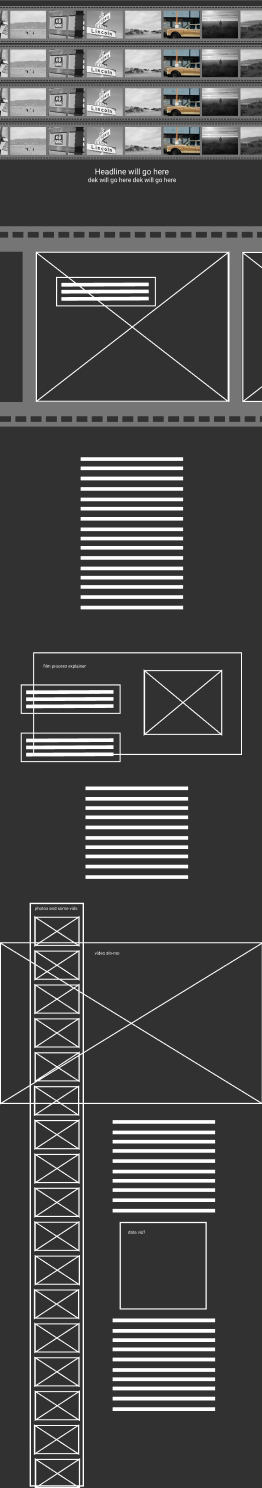
After building a wireframe of the story prototype (at left), I built the webpage using JavaScript and GSAP. We played into the film motif of the story: I formatted the introduction as a strip of film that scrolls sideways, layered photos on top of each other and implemented a dark visual theme to the page. By keeping visuals at the forefront of the story, we enhanced what could otherwise be an article bogged down by price stats and econ explainers.
the solution
Read the full story here! I'm really happy with how it turned out, and I think my team worked well together to tell this story. If I had more time to work on this, I'd better optimize the page for mobile screens, but this project gave me a great opportunity to learn about how to tell a story with visuals and data.